


Table of Contents
- Introduction
- Objective
- Conclusion
- Considerations
- Test Results
- Verification Environment
- Verification Procedure
- In conclusion
Introduction
The recently released Apache Solr 9.7.0 on September 9, 2024, includes performance improvements in semantic search (vector search). For more details, please refer to Solr 9.7.0 Release Highlights.
Apache Lucene upgraded to 9.11.1 introducing tremendous performance improvements when using Java 21 for vector search among other things.
These performance enhancements are made possible through the integration of the Incubating Panama Vector API, enabling SIMD optimizations for vector calculations in Java 20 and Java 21. To enable this feature by default, the option --add-modules jdk.incubator.vector has been added to the Solr Java command.
What is SIMD Optimization
SIMD(Single Instruction, Multiple Data) refers to a technique that applies the same operation to multiple data points simultaneously, increasing computational efficiency. SIMD is particularly effective for tasks requiring processing of large datasets, such as scientific computing and image/audio processing.
Key Points of SIMD Optimization
Hardware Support
- Requires CPUs or GPUs that support dedicated SIMD instruction sets (e.g., Intel’s SSE, AVX, ARM’s NEON).
Vectorization of Algorithms and Data Structures
- Data must be vectorized to enable efficient parallel processing, which can complicate implementation and debugging.
Performance Improvement through Data Parallel Processing
- Running the same operation on multiple data points simultaneously reduces processing time
- Significantly enhancing performance of applications by making effective use of system resources.
Benefits of Utilizing SIMD Optimization in Solr
In Apache Solr, SIMD optimization can substantially enhance search performance, especially in semantic searches. It enables fast and efficient searches for complex query processing and large datasets.
Improved Text Analysis Performance
- Tokenization and normalization processes are accelerated, leading to overall performance gains.
Enhanced Query Performance
- Vector calculations are expedited, improving the performance of semantic searches.
- Scoring and filtering can be processed in parallel, reducing the response time for search queries.
Improved Scalability
- Performance improves with large datasets suitable for SIMD, enhancing scalability.
Better User Experience
- Increased performance allows for faster retrieval of relevant results, leading to higher user satisfaction.
Tickets Related to SIMD Optimization in Solr Vector Calculations
- Enable Java Vector optimizations
- vector API integration, plan B #12302
- Integrate the Incubating Panama Vector API #12311
- Implement VectorUtilProvider with Java 21 Project Panama Vector API #12363
For more information on semantic search and its configuration, please refer to the documentation for our cloud-based search engine service, KanadaSearch, in the section What is Semantic Search?.
Objective
Evaluate the impact of SIMD optimization on vector calculation performance
Specifically, the focus is on comparing performance with and without SIMD optimization, using short test cases that can be executed quickly to allow for a broader range of performance comparisons. The tests are designed around the following aspects:
- How much does the performance of Solr vector calculations improve when SIMD optimization is applied in Java 20 and java 21?
- Does upgrading from Java 11 to Java 21 improve the performance of Solr vector calculations?
The testing methodology involves increasing the number of concurrent executions and query loads in Solr, measuring response times and resource utilization (CPU/MEMORY/DISK I/O) to quantify and visualize performance comparisons based on the measurements obtained.
Conclusion
The performance of semantic search was measured using the following three Java versions, and the results were compared:
- Case 1: Running Solr on Java 11.
- Case 2: Running Solr on Java 21 (without vector optimization).
- The
--add-modules jdk.incubator.vectoroption is removed from the Java command.
- The
- Case 3: Running Solr on Java 21 (with vector optimization).
- The Java command includes the
--add-modules jdk.incubator.vectoroption by default in Solr.
- The Java command includes the
The results indicated:
- Enabling SIMD optimization in Solr’s semantic search resulted in a performance improvement of 10% to 30%.
- Upgrading the Java version used by Solr from Java 11 to Java 21 did not show any performance improvement.
EC2 Instance Specifications and Solr Heap Size Used for Testing
| EC2 Instance | Processor | vCPU | Memory | Storage | Network Performance | SOLR_JAVA_MEM | On-Demand Hourly Rate |
|---|---|---|---|---|---|---|---|
| t4g.small | Arm-based AWS Graviton2 | 2 | 2 GiB | EBS Only | Up to 5 Gigabit | "-Xms512M -Xmx925M" | $0.0168 |
| t4g.medium | Arm-based AWS Graviton2 | 2 | 4 GiB | EBS Only | Up to 5 Gigabit | "-Xms512M -Xmx1920M" | $0.0336 |
| t4g.large | Arm-based AWS Graviton2 | 2 | 8 GiB | EBS Only | Up to 5 Gigabit | "-Xms512M -Xmx3909M" | $0.0672 |
| t4g.xlarge | Arm-based AWS Graviton2 | 4 | 16 GiB | EBS Only | Up to 5 Gigabit | "-Xms4G -Xmx8G" | $0.1344 |
| c7g.large | Arm-based AWS Graviton3(Compute-Optimized) | 2 | 4 GiB | EBS Only | Up to 12500 Megabit | "-Xms512M -Xmx1920M" | $0.0723 |
| c7g.xlarge | Arm-based AWS Graviton3(Compute-Optimized) | 4 | 8 GiB | EBS Only | Up to 12500 Megabit | "-Xms512M -Xmx3909M" | $0.1445 |
Response Time: The time taken from issuing a request to receiving the response (in seconds)
The following conditions were applied during the evaluation:
- The input vectors for semantic search queries consisted of 7367 types.
- JMeter's loop count was set to 7367 for the test.
- JMeter's concurrent user count was set up to 20 for the test.
- TopK was set to 1000.
Comparison of Response Times (sec) with SIMD Optimization Enabled and Disabled
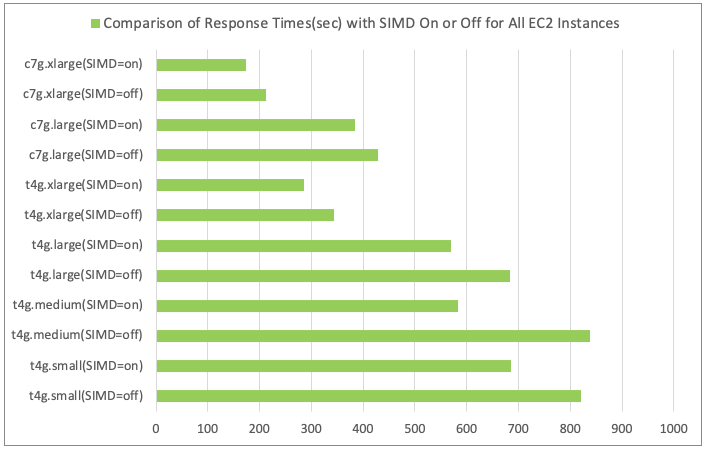
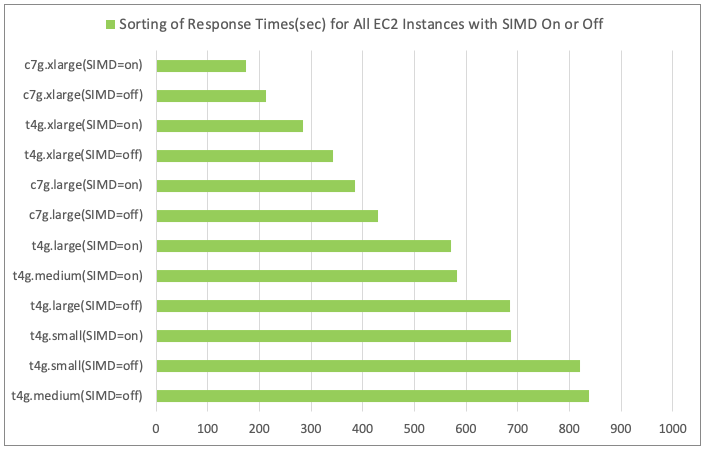
- Results of Sorting Response Times for All EC2 Instance Types
Discussion
- As the number of CPU cores increases, the degree of parallelism in vector calculations also increases, improving the performance of semantic search.
- Among the same number of requests, the instance with the shortest response time and fastest search was the computing-optimized instance c7g.xlarge.
- When comparing t4g.xlarge (vCPU 4/MEM 16 GiB) to t4g.large (vCPU 2/MEM 8 GiB), the response time was reduced by half.
- EC2's computing-optimized instances exhibited superior processor performance compared to general-purpose instances.
- When comparing c7g.large (vCPU 2/MEM 4 GiB) to t4g.large (vCPU 2/MEM 8 GiB), the response time was reduced by 27%. Despite having the same number of CPU cores and t4g having double the memory, the processor performance of c7g.large proved to be faster.
- The network performance of c7g.large is twice as fast as t4g; however, it did not impact this particular workload's network transfer volume.
- When comparing c7g.xlarge (vCPU 4/MEM 8 GiB) to t4g.xlarge (vCPU 4/MEM 16 GiB), the response time was reduced by 17%.
- When comparing c7g.large (vCPU 2/MEM 4 GiB) to t4g.large (vCPU 2/MEM 8 GiB), the response time was reduced by 27%. Despite having the same number of CPU cores and t4g having double the memory, the processor performance of c7g.large proved to be faster.
- Memory capacity and Solr heap size also contributed to semantic search performance, but not to the same extent as the CPU.
- When comparing t4g.large (vCPU 2/MEM 8 GiB) to t4g.medium (vCPU 2/MEM 4 GiB), the response time improved by only 2%.
- When comparing t4g.medium (vCPU 2/MEM 4 GiB) to t4g.small (vCPU 2/MEM 2 GiB), the response time improved by 15%, suggesting that 2 GiB of memory and 1 GiB of Solr heap is insufficient to handle the query load.
- As the number of CPU cores increases, the degree of parallelism in vector calculations also increases, improving the performance of semantic search.
Comparison of Response Time Reduction Rates Achieved by SIMD Optimization
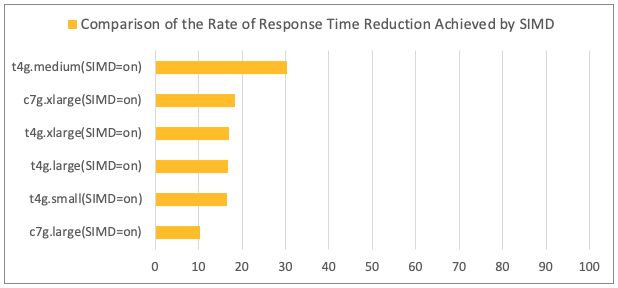
Discussion
- The application of SIMD optimization confirmed an improvement in vector calculation performance.
- When comparing Java 21 (with optimization enabled) to Java 21 (with optimization disabled), the response time was reduced by 10% to 30% (with an average reduction of 16%).
- The application of SIMD optimization confirmed an improvement in vector calculation performance.
Comparison of Response Times (sec) with TopK
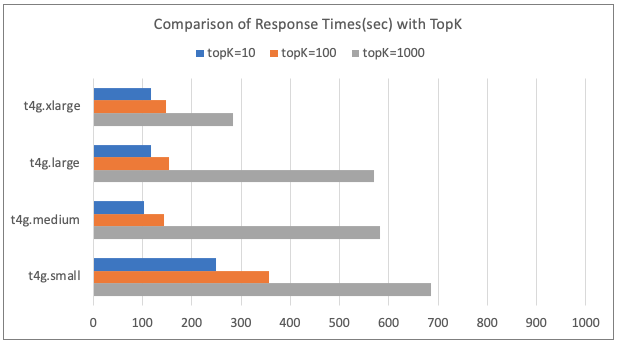
Discussion
- As the topK value in semantic search increased, the response time also increased.
- This suggests that a higher topK value leads to an increase in vector calculation load.
- As the topK value in semantic search increased, the response time also increased.
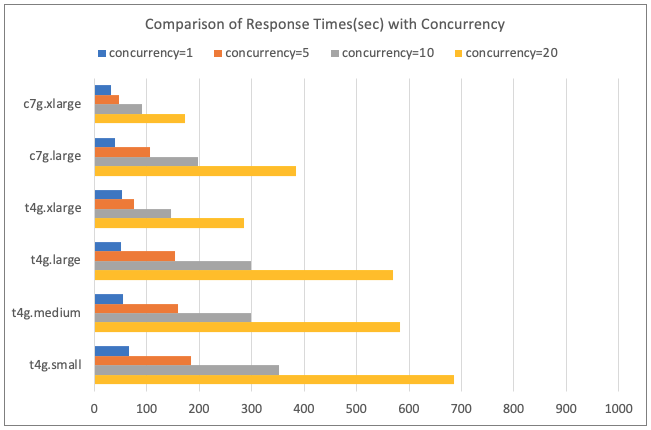
Comparison of Response Times (sec) with Concurrency
- Discussion
- As the number of concurrent users increased, the performance improvement became more significant.
- The response time reduction for a single user executing on t4g.xlarge (vCPU 4/MEM 16 GiB) was 10%, while for five concurrent users, it was 15%.
- Comparing the CPU usage of the Solr process using the top command, it was observed that only 1.5 vCPUs were used for one user, whereas all 4 vCPUs were utilized with five users.
- The increase in parallel vector calculations for five users compared to one user likely contributed to the greater performance improvement.
- The response time reduction for a single user executing on t4g.xlarge (vCPU 4/MEM 16 GiB) was 10%, while for five concurrent users, it was 15%.
- As the number of concurrent users increased, the performance improvement became more significant.
QPS (Queries/sec): The number of requests processed per second
The following conditions were verified:
- The input vectors for semantic search queries consisted of 7,367 types.
- JMeter's loop count was set to 7,367 for verification.
- JMeter's number of concurrent users was set to 20 for testing.
- TopK was set to 1000.
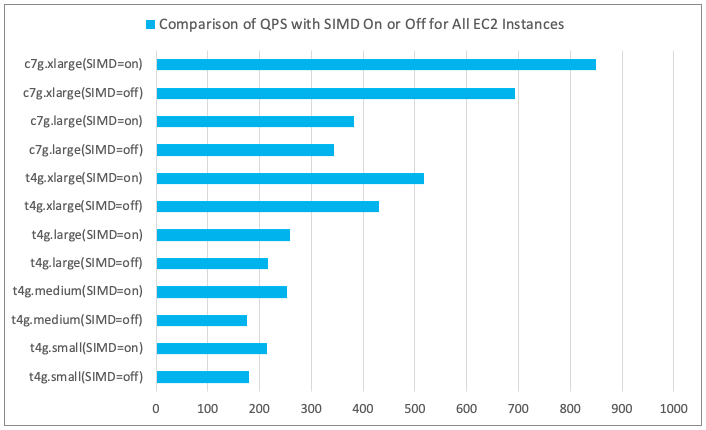
Comparison of QPS with SIMD Optimization Enabled and Disabled
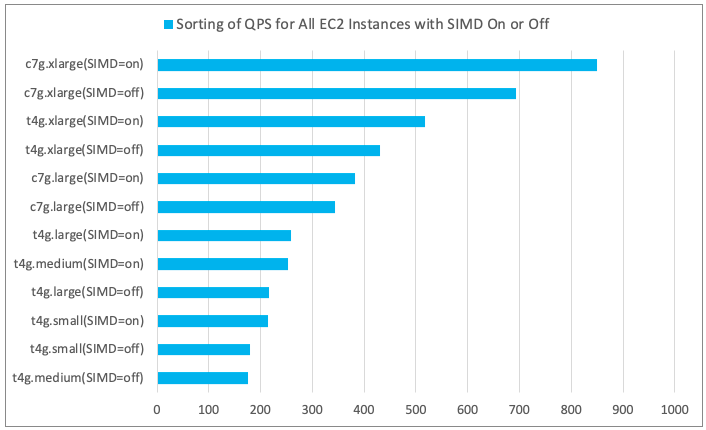
- Results of Sorting QPS for All EC2 Instance Types
- Discussion
- As the number of concurrent executions increased, QPS also increased; however, once a maximum value was reached, it did not change further.
Differences in Semantic Search Performance by Java Version
- No differences in vector calculation performance were observed based on Java version.
- When comparing Java 21 (with vector optimization disabled) to Java 11, the response times were nearly identical.
System Resources
CPU Usage
- Comparison of CPU Usage with SIMD Optimization Enabled/Disabled
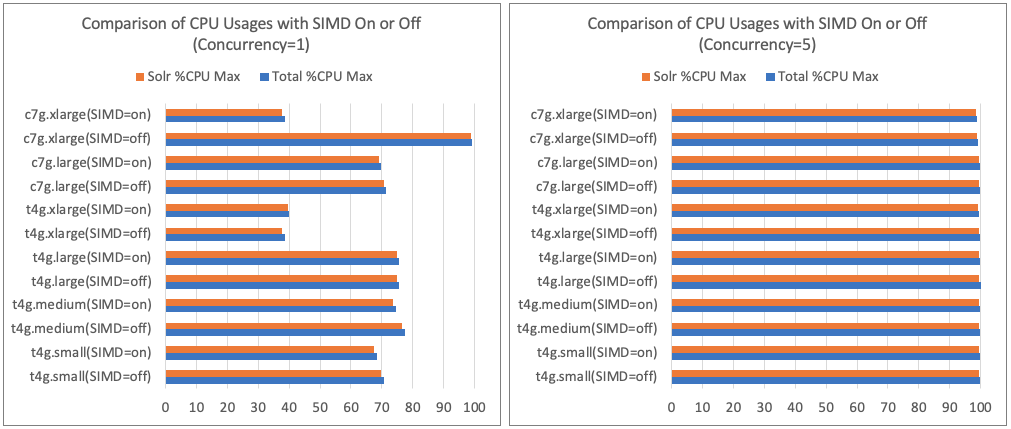
Discussion
- There was little increase in CPU usage due to SIMD optimization.
Comparison of CPU Usage by Concurrency
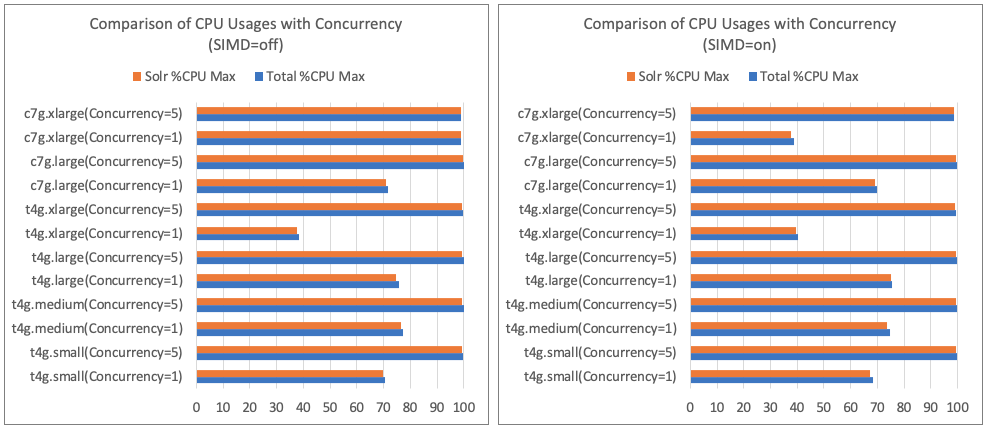
- Discussion
- With one concurrent user, Solr used a maximum of 1.5 vCPUs.
- As concurrency increased, CPU usage rose, reaching nearly 100% as concurrency matched the number of vCPUs.
- If the CPU usage of the Solr process reaches 100%, it indicates that all CPU cores are fully utilized for vector parallel calculations.
Memory Usage
- Comparison of Memory Usage with SIMD Optimization Enabled/Disabled
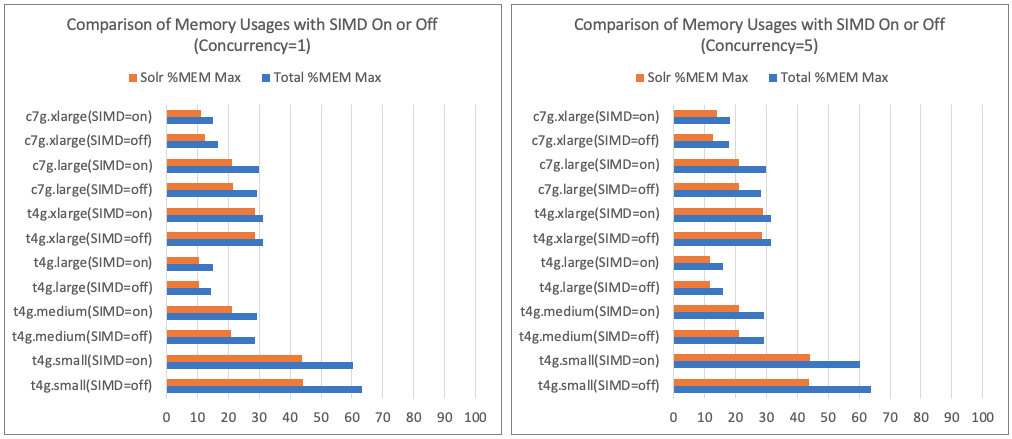
Discussion
- There was little increase in memory usage due to SIMD optimization.
Comparison of Memory Usage by Concurrency
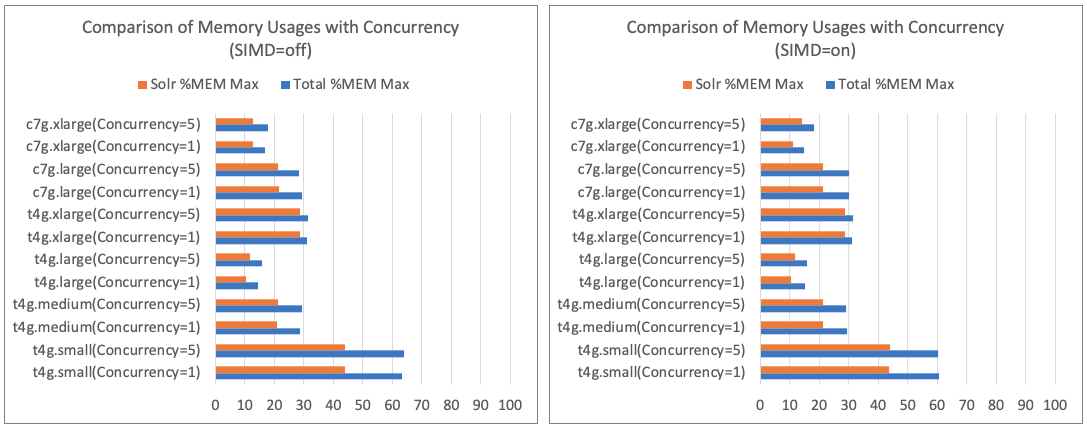
- Discussion
- There was little increase in memory usage due to concurrency.
- Significant performance degradation can occur due to swapping caused by memory shortages, so workloads were adjusted to prevent depletion of OS buffer cache during load testing.
Disk I/O Usage
- Discussion
- Throughout the load tests, there were no I/O wait states due to disk busy conditions, and I/O load did not become a bottleneck for search performance.
Considerations
Confirming that the Verification Server's Hardware and OS Kernel Support SIMD Optimization
In this verification, Amazon EC2's t4g.small instance was used. Below, I share the steps to confirm the support for SIMD optimization at the hardware and OS kernel level, using t4g.small as an example.
Confirming Hardware Support for SIMD Optimization
- Processor information was checked using the
lscpucommand:- CPU architecture: aarch64
- Vendor ID: ARM
- Model name: Neoverse-N1
- Flags:
asimd(Advanced SIMD) was set.
- Confirmed the support for SIMD by the
Neoverse-N1model from the ARM documentation About the Advanced SIMD and Floating Point Support:
  The Neoverse™ N1 core supports the Advanced SIMD and scalar floating-point
  instructions in the A64 instruction set and the Advanced SIMD and
  floating-point instructions in the A32 and T32 instruction sets.
Confirming OS (Kernel) Support for SIMD Optimization
A C sample program for multiplying float arrays was compiled using gcc's compilation options -O3 (optimization level) and -S (assembly code generation). From the generated assembly code, SIMD multiplication instructions of vector types were confirmed.
fmul    v2.4s, v2.4s, v6.4s
... ...
fmul    v0.4s, v0.4s, v4.4s
About the Input Vector Set Used in Semantic Search Queries
Pre-preparation of Input Vectors and Queries
To accurately evaluate the performance improvement of Solr semantic search due to SIMD optimization, it is necessary to ensure that other unrelated processes do not consume resources during load measurement.
The 7,367 input vectors included in the semantic search queries were pre-computed (rather than calculated on the fly during semantic search) and used as queries for JMeter load testing.
Variations of Input Vector Arrays Used in Queries
The variations and data distribution of vector datasets significantly affect the effectiveness of SIMD optimization. When the dataset is evenly distributed, the benefits of parallel processing are maximized. Conversely, if the data distribution is skewed, processing may concentrate on specific elements, making overall performance improvement challenging.
As a test, I prepared only 100 types of vectors (768 dimensions) and repeatedly used them in semantic searches. However, the performance measurement results were unstable and difficult to evaluate, so I ultimately used 7367 types of vectors (768 dimensions) for load testing.
Test Execution Environment and Method
- Load testing tools, JMeter and Solr, were placed on two instances within the same subnet of Amazon VPC to minimize the impact of network load.
- This is because during semantic searches, a large amount of vector data is sent to Solr over the network, and network bandwidth could become a bottleneck, affecting performance metrics such as QPS and Response Time.
- Load tests were conducted by varying the execution order of multiple test cases.
- The execution order may influence performance measurements.
- Solr was restarted each time a test case was executed.
- This was to prevent issues from the reuse of Solr caches during semantic searches from hindering performance evaluation.
- Important notes for using burst performance instances on Amazon EC2:
- Burst performance instances have a certain CPU burst quota, so if high load causes the CPU frequency to exceed the baseline frequency for an extended period, the CPU operation may slow down.
- If the CPU credits run out during verification, the burst (availability of CPU usage exceeding the baseline) will not function, potentially degrading Solr's search performance.
- It is necessary to monitor the usage and balance of CPU credits for EC2 instances to ensure that the balance does not deplete.
- CPU credit usage: The number of CPU credits spent during the measurement period.
- CPU credit balance: The number of CPU credits that an instance has accrued. This balance is depleted when the CPU bursts and CPU credits are spent more quickly than they are earned.
- There is also a method to set the CPU credit mode of burst performance instances to Unlimited.
- The Unlimited mode allows the burst state to be maintained even when CPU credits are depleted, but additional costs are incurred per vCPU hour.
- Burst performance instances have a certain CPU burst quota, so if high load causes the CPU frequency to exceed the baseline frequency for an extended period, the CPU operation may slow down.
Test Results
Explanation of Various Items in the Result Matrix
- Users: The number of concurrent executions (simultaneous users) indicated by JMeter's Num_threads value.
- QPS: The number of queries processed per unit time, as indicated by JMeter's QPS value.
- Response Time: The time taken from issuing a query to receiving a response (in seconds).
- %CPU: The system's CPU usage percentage (measured by the vmstat command).
- %MEM: The system's memory usage percentage (measured by the vmstat command).
- %I/O: The system's Disk I/O usage percentage (measured by the iostat command).
Search Performance
Load Measurement Method
- Measurement results when using 7367 types of vector values in JMeter queries.
- The loop count for JMeter queries was fixed at 7367.
- Load measurements were performed twice for different concurrent execution numbers and Java versions, and the average was calculated.
- There are 72 verification patterns.
Performance Comparison Across EC2 Instances/Java Versions/Concurrent Executions (Resource Usage and Response Time Reduction Rate)
| Id | EC2 Instance | JavaVer | SIMD Optimization | Concurrency | QPS | ResponseTime(sec) | Total %CPU Max | Solr %CPU Max | Total %MEM Max | Solr %MEM Max | Total %I/O Max | ResponseTimeReductionRate(%) By Number Of Concurrent Users | ResponseTimeReductionRate(%) By Vector Optimization | ResponseTimeReductionRate(%) By Ec2 Instance with small | ResponseTimeReductionRate(%) By Ec2 Instance with CPU cores | ResponseTimeReductionRate(%) By Java Version |
|---|---|---|---|---|---|---|---|---|---|---|---|---|---|---|---|---|
| 1 | t4g.small | Java11 | off | 1 | 103 | 72 | 75 | 74 | 57 | 40 | 1 | 0 | 0 | 0 | 0 | 0 |
| 2 | t4g.small | Java11 | off | 5 | 174 | 212 | 100 | 99 | 60 | 44 | 1 | 41 | 0 | 0 | 0 | 0 |
| 3 | t4g.small | Java11 | off | 10 | 175 | 421 | 100 | 99 | 60 | 44 | 1 | 42 | 0 | 0 | 0 | 0 |
| 4 | t4g.small | Java11 | off | 20 | 179 | 823 | 100 | 99 | 61 | 45 | 4 | 43 | 0 | 0 | 0 | 0 |
| 5 | t4g.small | Java21 | off | 1 | 102 | 73 | 71 | 70 | 63 | 44 | 1 | 0 | 0 | 0 | 0 | -1 |
| 6 | t4g.small | Java21 | off | 5 | 171 | 215 | 100 | 99 | 64 | 44 | 1 | 41 | 0 | 0 | 0 | -1 |
| 7 | t4g.small | Java21 | off | 10 | 179 | 413 | 100 | 99 | 63 | 44 | 2 | 43 | 0 | 0 | 0 | 2 |
| 8 | t4g.small | Java21 | off | 20 | 180 | 821 | 100 | 99 | 65 | 44 | 15 | 44 | 0 | 0 | 0 | 0 |
| 9 | t4g.small | Java21 | on | 1 | 111 | 67 | 68 | 67 | 60 | 44 | 0 | 0 | 9 | 0 | 0 | 0 |
| 10 | t4g.small | Java21 | on | 5 | 201 | 184 | 100 | 99 | 60 | 44 | 0 | 45 | 15 | 0 | 0 | 0 |
| 11 | t4g.small | Java21 | on | 10 | 209 | 353 | 100 | 99 | 60 | 43 | 1 | 47 | 15 | 0 | 0 | 0 |
| 12 | t4g.small | Java21 | on | 20 | 215 | 686 | 100 | 100 | 63 | 45 | 48 | 48 | 16 | 0 | 0 | 0 |
| 13 | t4g.medium | Java11 | off | 1 | 110 | 67 | 79 | 79 | 28 | 20 | 1 | 0 | 0 | 7 | 7 | 0 |
| 14 | t4g.medium | Java11 | off | 5 | 173 | 214 | 100 | 99 | 29 | 21 | 0 | 36 | 0 | -1 | -1 | 0 |
| 15 | t4g.medium | Java11 | off | 10 | 177 | 418 | 100 | 99 | 31 | 23 | 0 | 38 | 0 | 1 | 1 | 0 |
| 16 | t4g.medium | Java11 | off | 20 | 177 | 834 | 100 | 99 | 33 | 25 | 1 | 38 | 0 | -1 | -1 | 0 |
| 17 | t4g.medium | Java21 | off | 1 | 108 | 69 | 77 | 76 | 29 | 21 | 2 | 0 | 0 | 5 | 5 | -3 |
| 18 | t4g.medium | Java21 | off | 5 | 172 | 214 | 100 | 99 | 29 | 21 | 2 | 38 | 0 | 0 | 0 | 0 |
| 19 | t4g.medium | Java21 | off | 10 | 176 | 420 | 100 | 100 | 29 | 21 | 2 | 39 | 0 | -2 | -2 | 0 |
| 20 | t4g.medium | Java21 | off | 20 | 176 | 838 | 100 | 100 | 29 | 21 | 1 | 39 | 0 | -2 | -2 | 0 |
| 21 | t4g.medium | Java21 | on | 1 | 134 | 55 | 75 | 73 | 29 | 21 | 0 | 0 | 20 | 17 | 17 | 0 |
| 22 | t4g.medium | Java21 | on | 5 | 231 | 160 | 100 | 99 | 29 | 21 | 0 | 42 | 25 | 13 | 13 | 0 |
| 23 | t4g.medium | Java21 | on | 10 | 247 | 299 | 100 | 99 | 30 | 21 | 0 | 46 | 29 | 15 | 15 | 0 |
| 24 | t4g.medium | Java21 | on | 20 | 253 | 583 | 100 | 99 | 30 | 21 | 0 | 47 | 30 | 15 | 15 | 0 |
| 25 | t4g.large | Java11 | off | 1 | 127 | 58 | 77 | 77 | 15 | 11 | 4 | 0 | 0 | 19 | 13 | 0 |
| 26 | t4g.large | Java11 | off | 5 | 202 | 182 | 100 | 99 | 16 | 12 | 1 | 37 | 0 | 14 | 15 | 0 |
| 27 | t4g.large | Java11 | off | 10 | 209 | 353 | 100 | 99 | 17 | 12 | 1 | 39 | 0 | 16 | 16 | 0 |
| 28 | t4g.large | Java11 | off | 20 | 214 | 687 | 100 | 99 | 23 | 19 | 1 | 41 | 0 | 17 | 18 | 0 |
| 29 | t4g.large | Java21 | off | 1 | 130 | 57 | 76 | 75 | 14 | 11 | 1 | 0 | 0 | 22 | 17 | 2 |
| 30 | t4g.large | Java21 | off | 5 | 199 | 185 | 100 | 99 | 16 | 12 | 1 | 35 | 0 | 14 | 14 | -2 |
| 31 | t4g.large | Java21 | off | 10 | 204 | 361 | 100 | 100 | 17 | 12 | 7 | 37 | 0 | 13 | 14 | -2 |
| 32 | t4g.large | Java21 | off | 20 | 215 | 684 | 100 | 100 | 16 | 12 | 26 | 40 | 0 | 17 | 18 | 0 |
| 33 | t4g.large | Java21 | on | 1 | 143 | 52 | 76 | 75 | 15 | 10 | 1 | 0 | 9 | 22 | 5 | 0 |
| 34 | t4g.large | Java21 | on | 5 | 241 | 154 | 100 | 100 | 16 | 12 | 1 | 41 | 17 | 16 | 4 | 0 |
| 35 | t4g.large | Java21 | on | 10 | 247 | 299 | 100 | 100 | 16 | 12 | 77 | 43 | 17 | 15 | 0 | 0 |
| 36 | t4g.large | Java21 | on | 20 | 259 | 570 | 100 | 100 | 17 | 12 | 80 | 45 | 17 | 17 | 2 | 0 |
| 37 | t4g.xlarge | Java11 | off | 1 | 126 | 59 | 38 | 37 | 22 | 20 | 1 | 0 | 0 | 18 | -2 | 0 |
| 38 | t4g.xlarge | Java11 | off | 5 | 401 | 92 | 100 | 99 | 22 | 20 | 1 | 69 | 0 | 57 | 49 | 0 |
| 39 | t4g.xlarge | Java11 | off | 10 | 417 | 177 | 100 | 100 | 22 | 20 | 1 | 70 | 0 | 58 | 50 | 0 |
| 40 | t4g.xlarge | Java11 | off | 20 | 443 | 333 | 100 | 100 | 23 | 20 | 1 | 72 | 0 | 60 | 52 | 0 |
| 41 | t4g.xlarge | Java21 | off | 1 | 126 | 59 | 39 | 38 | 31 | 29 | 1 | 0 | 0 | 19 | -4 | 0 |
| 42 | t4g.xlarge | Java21 | off | 5 | 405 | 91 | 100 | 99 | 31 | 29 | 0 | 69 | 0 | 58 | 51 | 1 |
| 43 | t4g.xlarge | Java21 | off | 10 | 425 | 174 | 100 | 100 | 31 | 29 | 0 | 71 | 0 | 58 | 52 | 2 |
| 44 | t4g.xlarge | Java21 | off | 20 | 431 | 343 | 100 | 100 | 31 | 29 | 0 | 71 | 0 | 58 | 50 | -3 |
| 45 | t4g.xlarge | Java21 | on | 1 | 140 | 53 | 40 | 39 | 31 | 29 | 0 | 0 | 10 | 20 | -2 | 0 |
| 46 | t4g.xlarge | Java21 | on | 5 | 482 | 77 | 99 | 99 | 31 | 29 | 0 | 71 | 15 | 58 | 50 | 0 |
| 47 | t4g.xlarge | Java21 | on | 10 | 506 | 146 | 100 | 100 | 31 | 29 | 0 | 72 | 16 | 59 | 51 | 0 |
| 48 | t4g.xlarge | Java21 | on | 20 | 518 | 285 | 100 | 100 | 31 | 29 | 1 | 73 | 17 | 58 | 50 | 0 |
| 49 | c7g.large | Java11 | off | 1 | 187 | 39 | 100 | 99 | 33 | 25 | 3 | 0 | 0 | 46 | 33 | 0 |
| 50 | c7g.large | Java11 | off | 5 | 322 | 115 | 100 | 99 | 28 | 21 | 1 | 41 | 0 | 46 | 37 | 0 |
| 51 | c7g.large | Java11 | off | 10 | 324 | 227 | 100 | 99 | 34 | 28 | 1 | 42 | 0 | 46 | 36 | 0 |
| 52 | c7g.large | Java11 | off | 20 | 336 | 439 | 100 | 99 | 34 | 28 | 1 | 44 | 0 | 47 | 36 | 0 |
| 53 | c7g.large | Java21 | off | 1 | 73 | 46 | 72 | 71 | 29 | 21 | 82 | 0 | 0 | 37 | 19 | -18 |
| 54 | c7g.large | Java21 | off | 5 | 312 | 118 | 100 | 100 | 28 | 21 | 1 | 49 | 0 | 45 | 36 | -3 |
| 55 | c7g.large | Java21 | off | 10 | 337 | 219 | 100 | 100 | 28 | 21 | 1 | 52 | 0 | 47 | 39 | 4 |
| 56 | c7g.large | Java21 | off | 20 | 344 | 429 | 100 | 100 | 29 | 21 | 1 | 53 | 0 | 48 | 37 | 2 |
| 57 | c7g.large | Java21 | on | 1 | 187 | 39 | 70 | 69 | 30 | 21 | 1 | 0 | 15 | 41 | 25 | 0 |
| 58 | c7g.large | Java21 | on | 5 | 348 | 106 | 100 | 99 | 30 | 21 | 1 | 46 | 10 | 42 | 31 | 0 |
| 59 | c7g.large | Java21 | on | 10 | 373 | 198 | 100 | 100 | 30 | 21 | 1 | 49 | 10 | 44 | 34 | 0 |
| 60 | c7g.large | Java21 | on | 20 | 383 | 385 | 100 | 100 | 30 | 22 | 2 | 51 | 10 | 44 | 32 | 0 |
| 61 | c7g.xlarge | Java11 | off | 1 | 203 | 37 | 39 | 38 | 16 | 12 | 1 | 0 | 0 | 49 | 37 | 0 |
| 62 | c7g.xlarge | Java11 | off | 5 | 625 | 59 | 99 | 99 | 16 | 12 | 1 | 68 | 0 | 72 | 36 | 0 |
| 63 | c7g.xlarge | Java11 | off | 10 | 677 | 109 | 100 | 99 | 16 | 12 | 1 | 71 | 0 | 74 | 38 | 0 |
| 64 | c7g.xlarge | Java11 | off | 20 | 708 | 208 | 99 | 99 | 18 | 15 | 1 | 72 | 0 | 75 | 38 | 0 |
| 65 | c7g.xlarge | Java21 | off | 1 | 206 | 36 | 99 | 99 | 17 | 13 | 1 | 0 | 0 | 51 | 39 | 3 |
| 66 | c7g.xlarge | Java21 | off | 5 | 638 | 58 | 99 | 99 | 18 | 13 | 2 | 68 | 0 | 73 | 36 | 2 |
| 67 | c7g.xlarge | Java21 | off | 10 | 669 | 110 | 100 | 99 | 17 | 13 | 2 | 69 | 0 | 73 | 37 | -1 |
| 68 | c7g.xlarge | Java21 | off | 20 | 693 | 213 | 100 | 99 | 18 | 13 | 1 | 70 | 0 | 74 | 38 | -2 |
| 69 | c7g.xlarge | Java21 | on | 1 | 231 | 32 | 39 | 38 | 15 | 11 | 7 | 0 | 11 | 52 | 40 | 0 |
| 70 | c7g.xlarge | Java21 | on | 5 | 766 | 48 | 99 | 99 | 18 | 14 | 5 | 70 | 17 | 74 | 38 | 0 |
| 71 | c7g.xlarge | Java21 | on | 10 | 812 | 91 | 100 | 99 | 18 | 14 | 4 | 72 | 17 | 74 | 38 | 0 |
| 72 | c7g.xlarge | Java21 | on | 20 | 849 | 174 | 100 | 99 | 18 | 14 | 4 | 73 | 18 | 75 | 39 | 0 |
Verification Environment
Amazon EC2 Instances
To prevent competition for resources between JMeter and Solr, JMeter is installed on a separate server from Solr. However, to minimize the impact of network load on verification results, JMeter and Solr are placed on EC2 instances within the same VPC subnet.
EC2 instance for JMeter server:
- t4g.small
EC2 instances for Solr server:
- t4g.small
- t4g.medium
- t4g.large
- t4g.xlarge
- c7g.large
- c7g.xlarge
- OS: Ubuntu 20.04.6 LTS
Verification Procedure
Environment Preparation
Install Java 11 and Java 21 on the Solr instance and set it up for switching
- Install Java 11 (reference: https://docs.aws.amazon.com/ja_jp/corretto/latest/corretto-11-ug/generic-linux-install.html)
$ wget -O- https://apt.corretto.aws/corretto.key | sudo apt-key add -
sudo add-apt-repository 'deb https://apt.corretto.aws stable main'

$ sudo apt-get update; sudo apt-get install -y java-11-amazon-corretto-jdk
- Install Java 21 (reference: https://docs.aws.amazon.com/ja_jp/corretto/latest/corretto-21-ug/generic-linux-install.html)
$ wget -O - https://apt.corretto.aws/corretto.key | sudo gpg --dearmor -o /usr/share/keyrings/corretto-keyring.gpg && \
echo "deb [signed-by=/usr/share/keyrings/corretto-keyring.gpg] https://apt.corretto.aws stable main" | sudo tee /etc/apt/sources.list.d/corretto.list

$ sudo apt-get update; sudo apt-get install -y java-21-amazon-corretto-jdk
- Switching Java Version
$ sudo update-alternatives --config java

There are 3 choices for the alternative java (providing /usr/bin/java).

  Selection    Path                                           Priority   Status
------------------------------------------------------------
* 0            /usr/lib/jvm/java-21-amazon-corretto/bin/java   12100004  auto mode
  1            /usr/lib/jvm/java-11-amazon-corretto/bin/java   11100024  manual mode
  2            /usr/lib/jvm/java-21-amazon-corretto/bin/java   12100004  manual mode

Press <enter> to keep the current choice[*], or type selection number: 1
update-alternatives: using /usr/lib/jvm/java-11-amazon-corretto/bin/java to provide /usr/bin/java (java) in manual mode

$ java --version
openjdk 11.0.24 2024-07-16 LTS
OpenJDK Runtime Environment Corretto-11.0.24.8.1 (build 11.0.24+8-LTS)
OpenJDK 64-Bit Server VM Corretto-11.0.24.8.1 (build 11.0.24+8-LTS, mixed mode)
Install the iostat command on the Solr instance
$ sudo apt install sysstat
Install the load testing tool JMeter on a separate server from Solr
- Download JMeter
$ wget https://dlcdn.apache.org//jmeter/binaries/apache-jmeter-5.6.3.tgz
Unzip
$ tar zxvf apache-jmeter-5.6.3.tgzFor testing, run the jmeter command with a report
./apache-jmeter-5.6.3/bin/jmeter -n -t test.jmx -Jusers=$1 -l jmeter-query.log -e -o ./jmeter-reportFor testing, run the jmeter command without a report
./apache-jmeter-5.6.3/bin/jmeter -n -t test.jmx -Jusers=$1 -j jmeter-`date +'%Y%m%d%H%M%S'`.log
Solr Configuration
Configuration for Semantic Search
It is necessary to add field types and fields for semantic search in the Solr schema definition.
Two fields of the field type solr.DenseVectorField for 768-dimensional vectors were added.
<fieldType name="knn_vector" class="solr.DenseVectorField" vectorDimension="768" similarityFunction="dot_product"/>
  <field name="body_vector" type="knn_vector" indexed="true" stored="true"/>
  <field name="title_vector" type="knn_vector" indexed="true" stored="true"/>
Since the types of input vectors used in queries also affect the effectiveness of SIMD optimization for vectors, I pre-calculated 7367 types of vector values and prepared 7367 queries using these input vectors.
For more details on the Solr settings required for semantic search, please refer to the documentation of our cloud-based search engine service, KanadaSearch: Semantic search features of Apache Solr.
Solr Heap Size
The Solr heap size was set according to the specifications of the verification server as follows:
SOLR_JAVA_MEM="-Xms512M -Xmx925M"
Solr Log Settings
Since excessive logging during load testing can lead to system load, the log size was changed to the minimum necessary.
Set a smaller rotation size and generation count in:
/var/solr/log4j2.xml<SizeBasedTriggeringPolicy size="1 MB"/><DefaultRolloverStrategy max="1"/>
Change the log level to error and disable request logging in:
/var/solr/solr.in.sh- Change log level:
SOLR_LOG_LEVEL=ERROR - Disable request logging:
SOLR_REQUESTLOG_ENABLED=false
- Change log level:
Performing Vector Indexing and Testing Semantic Search
Preparing Data for Indexing
We will use the Livedoor News Corpus (embeddings) data provided by the KandaSearch extension library. The 7367 documents already have 768-dimensional vectors assigned.
For details on semantic search using the Livedoor News Corpus (embeddings), please refer to the documentation for our cloud-based search engine service, KanadaSearch, Semantic search feature of KandaSearch.
Creating Solr Collection
We will create a Solr collection using the Livedoor News Corpus (embeddings) configuration provided by the KandaSearch extension library.
Indexing Vector Data
We will POST the vectorized Livedoor News Corpus (embeddings) data to Solr.
$ /opt/solr/bin/solr post -c livedoor ./data/livedoor_embeddings.json

Posting files to [base] url http://localhost:8983/solr/livedoor/update...
Entering auto mode. File endings considered are xml,json,jsonl,csv,pdf,doc,docx,ppt,pptx,xls,xlsx,odt,odp,ods,ott,otp,ots,rtf,htm,html,txt,log
POSTing file livedoor_embeddings.json (application/json) to [base]/json/docs
1 files indexed.
COMMITting Solr index changes to http://localhost:8983/solr/livedoor/update...
WARNING: URLs provided to this tool needn't include Solr's context-root (e.g. "/solr"). Such URLs are deprecated and support for them will be removed in a future release. Correcting from [http://localhost:8983/solr] to [http://localhost:8983/].
Time spent: 0:01:30.047
Preparing Vector Queries
The input vectors for the semantic search queries will be extracted from all documents in the aforementioned Livedoor News Corpus (embeddings) data, totaling 7367 768-dimensional vectors (query creation may take several hours).
- Extract the 7367
body_vectorvalues fromlivedoor_embeddings.json.
% for i in {0..7366}; do command="jq -r '[.[] | .body_vector] | nth($i)' ../livedoor_embeddings.json > vector-$i.json" && eval $command ;done
- Use the above vectors to create 7367 queries with the
qparameter.
for i in {0..7366}; do echo "{!knn f=body_vector topK=10}"$(cat vector-$i.json | tr -d '\n' | tr -d ' ') >> vector-query-7367.csv ;done
- Here’s a sample of the created queries.
{!knn f=body_vector topK=10}[-0.02621307782828808,-0.06952571868896484,-0.0034800975117832422,...(768 dimensions)]
Verifying Semantic Search Functionality
- Issue a vector query.
$ curl -g 'http://localhost:8983/solr/livedoor/query?q={!knn%20f=body_vector%20topK=10}[-0.02621307782828808,-0.06952571868896484,-0.0034800975117832422,...(768 dimensions)]'
- The following response will be returned from Solr.
{
  "responseHeader":{
    "status":0,
    "QTime":11,
    "params":{
      "q":"{!knn f=body_vector topK=10}[-0.02621307782828808,-0.06952571868896484,...
    }
  },
  "response":{
    "numFound":10,
    "start":0,
    "numFoundExact":true,
    "docs":[{
      "id":"movie-enter-5978741.txt",
      "url":"http://news.livedoor.com/article/detail/5978741/",
      "category":"movie-enter",
      "title":"【DVDエンター!】... ...",
      "title_exact":"【DVDエンター!】... ...",
      "title_2g":"【DVDエンター!】......",
  ... ...
Starting Load Testing for Semantic Search
From JMeter, specify different simultaneous user counts and loop counts to measure performance metrics such as QPS, Response Time, and system resource usage.
Performance measurements will be conducted for three Java versions: Java 11, Java 21 (vector optimization disabled), and Java 21 (vector optimization enabled).
To disable vector optimization for Java 21, the
--add-modules jdk.incubator.vectoroption was commented out in the Solr startup command/opt/solr/bin/solr:
#  if [[ "$JAVA_VER_NUM" -ge "20" ]] && [[ "$JAVA_VER_NUM" -le "21" ]] ; then
#    SCRIPT_SOLR_OPTS+=("--add-modules" "jdk.incubator.vector")
#    echo "Java $JAVA_VER_NUM detected. Incubating Panama Vector APIs have been enabled"
# fi
- To ensure that previous test case executions do not impact the current run (due to resource consumption or Solr cache), Solr will be restarted at the beginning of each new test case.
Reviewing Test Results
JMeter Performance Measurement Results
Resource Measurement Results from vmstat/iostat/top Commands
Checking Solr Logs
Verify that no errors occurred during the load testing period, particularly looking for OutOfMemory (OOM) errors or process kills due to memory shortages.
Example command to check for errors in Solr logs:
$ sudo grep -i err /var/solr/logs/* | grep -v " INFO "
Checking System Logs
Verify that no errors occurred during the load testing period, particularly looking for OutOfMemory (OOM) errors or process kills due to memory shortages.
Example command to check for errors in syslog:
$ sudo grep -i err /var/log/syslog
In conclusion
We conducted load testing using Apache Solr 9.7.0 and confirmed that SIMD optimization significantly improved the performance of semantic search (vector search). We also shared the verification procedures, precautions, insights, and observations from the load testing of semantic search, hoping it will be of assistance in your business activities.