Resource Monitoring
Here, we'll explain monitoring for the usage status of Apache Solr instance resources.
Page Sections
- What is monitoring?
- To utilize monitoring
- Monitoring items
- Display settings
- Monitoring via graphs
- Monitoring via data
What is monitoring?
'Monitoring'(Resource Monitoring) refers to the functionality where KandaSearch retains the usage status of server resources on nodes running Apache Solr for a certain period, allowing users to check these resource statuses at any time from the management console of KandaSearch.
The storage of usage data for server resources used in monitoring begins automatically when an Apache Solr instance is created.
The monitoring feature is available on the Standard plan or higher.
To utilize monitoring
To use monitoring, follow these steps to display the monitoring screen.
- Log in to KandaSearch here.
- From the list of projects, click on the desired project name. (To display the list of projects, click on the KandaSearch logo at the top left of the screen.)
- From the project overview, click on the name of the target instance.
- From the left side menu of the instance view, click on 'Monitoring'.
- The monitoring screen will be displayed.
- For SolrCloud configurations, select the node to be displayed from 'Instance Node'.
Monitoring items
The monitoring items are as follows:
- CPU usage (%)
- Memory usage (%)
- Disk usage (%) - Usage rate of the user space.
- Root disk I/O (%) - Usage rate of the device used of the OS.
- Solr disk I/O (%) - Usage rate of the device used of Solr.
In monitoring, the above items can be displayed either as 'graphs' or as a 'data' list showing numerical values.
Display settings
In the monitoring screen, the following display settings are available:
- Time Period: The value specified here determines the horizontal axis of the 'graphs' and the display range of the 'data.'
- End Date/Time: The date and time specified here up to the value specified in 'Period' are the targets for display.
- NOW: Clicking here sets the date and time at the moment as the 'End date and time' and refreshes the display.
- Refresh rate: When 'off' is selected, automatic updates of the display are not performed. Choose from 15 seconds, 30 seconds, or 1 minute for automatic updates.
- DOWNLOAD DATA: Download the displayed data in CSV file format.
Monitoring via graphs
When displaying monitoring information as graphs, click the 'GRAPH' button.
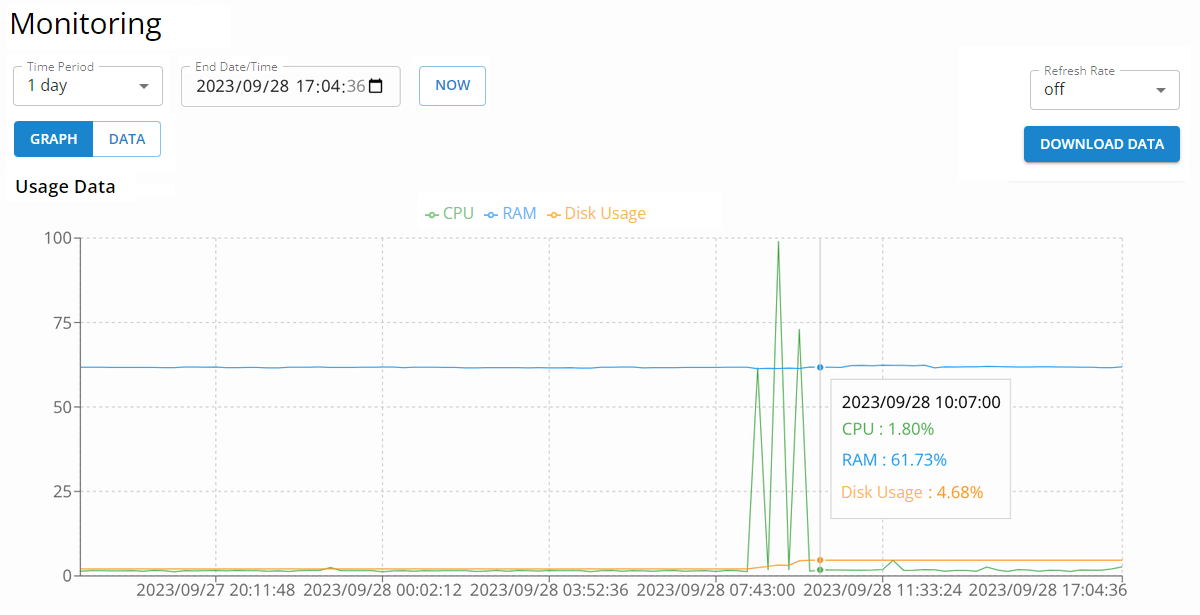
Notes.
- When you click on the legend at the top of the graph (showing 'CPU', 'RAM', 'Disk Usage'), you can toggle the visibility of that item within the graph.
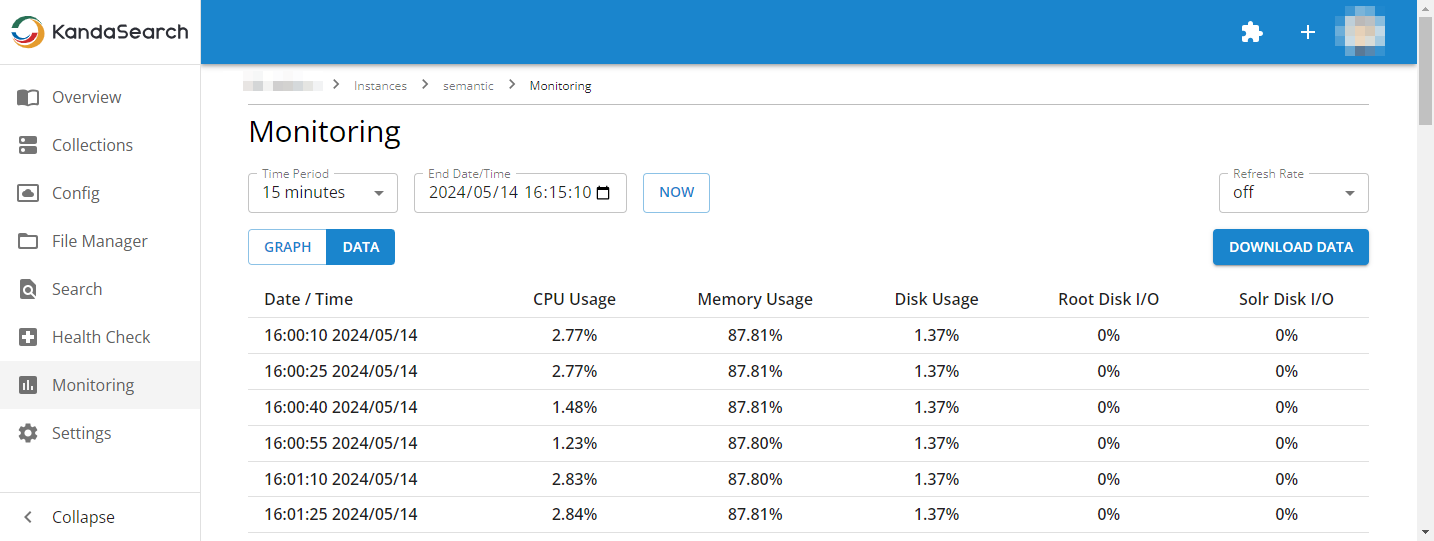
Monitoring via data
When displaying monitoring information as a list of numerical values ('data'), click the 'DATA' button.